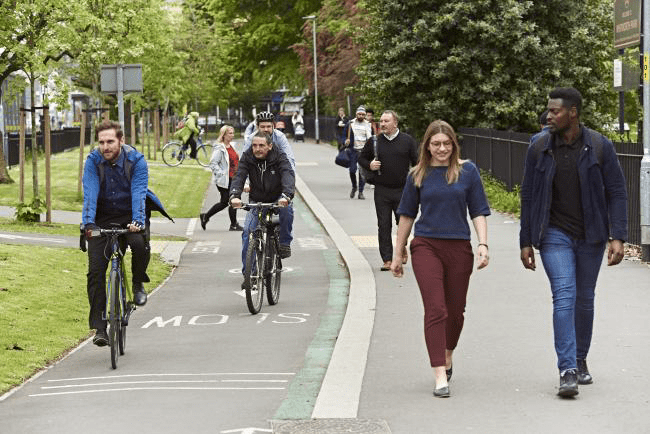
If only Northampton had routes like this!
Northampton is a long way behind other towns and cities – this plan points out that 56% of short journeys in Northampton are made by car, which is well above the national average. The plan could also point out that Northampton scored 1 out of 4 in the government’s Active Travel capability ratings (Leicester and Nottingham scored 3).
Most urban areas are now very aware of the problems caused by the overuse of private cars for short journeys; all of our nearby cities are years ahead of Northampton, with significant improvements continuously being made to the infrastructure to discourage driving and encourage the use of buses and active travel.
There are no safe active travel routes into or through Northampton town centre and we have many complete no-go areas for cycling. For example, most people would not even consider cycling in through Abington Square, or the Park Avenue/Wellingborough Road junction, or the Park Avenue/Kettering Road junction. This is why we have so many bikes and scooters on our pavements, which often make our streets feel dangerous for walking too.
What does government policy say?
The Department for Transport’s Decarbonising Transport (p29) states: “We cannot simply believe that zero emission cars and lorries will meet all our climate goals or solve all our problems. They will not… we must increase the share of trips taken by public transport, cycling and walking. We want to make these modes the natural first choice for all who can take them.”
